


How to find shares that can defend themselves (and you) you against inflation and recession
A quality-focused strategy that aims to find profitable companies in defensive sectors that are better placed to resist economic headwinds

Strategy brief
The health of the economy has a major influence on stock market performance. In periods of stability and growth, strong companies can do well, and even weak companies can survive. But with macroeconomic headwinds like high-and-rising inflation or recession (or both), many companies can suffer, and some will inevitably go bust.
This investment strategy takes a defensive approach to a gloomy economic outlook. It aims to find companies that are better placed to resist the pressures of rising costs and economic contraction. It does it by pinpointing defensive industry sectors and looking for companies with high quality profitability and solid dividends.
With this strategy the objective is to find:
Shares in defensive sectors that are better at withstanding economic stress
Companies with strong profit margins that can protect them from higher costs and weaker demand
Companies that are efficient, with good cost control and low capital intensity
Companies with a good track record of paying dividends
Background
An important feature of the stock market is that it tends to be forward-looking. Prices are constantly being adjusted in response to what the market thinks the future holds. So it’s no surprise that prices come under pressure when there is economic turmoil on the horizon.
Turmoil itself can manifest in different ways, but two of the most feared phases in the economic cycle are high-and-rising inflation and recession. These two events don’t often coincide, but when they do it’s called stagflation (where you get stagnant growth and inflation simultaneously), and that can be particularly painful.
Inflation basics
Inflation (and deflation) measure the change in the price of goods and services over time
The Bank of England has an inflation target of 2.0%, which is a common target rate across many developed economies
Inflation is usually caused by substantial changes in supply and demand in the economy
Rising inflation can be a pointer to economic growth, which boosts company earnings (usually as a result of demand-pull factors like rising consumer demand). At low and stable levels, this is good inflation
Rising inflation can also be driven by cost-push factors (where you get rising input prices that are not driven by an increase in demand). This is bad inflation
Research shows that stock market returns are worst when inflation is high (above 3%) and rising. In most other scenarios (when it’s either low-and-rising or high-and-falling) returns are substantially unaffected.

The market dislikes high inflation because one of the few ways to control it is for central banks to raise interest rates. Higher interest rates can slow inflation by reducing demand in the economy, but this can lead to recession.
For companies (and investors), the potential problems of high-and-rising inflation are:
Lower demand because customers have less purchasing power (which damages sales)
Rising costs for raw materials, services, energy and staff (which damages profits)
Rising interest rates may cause recession (which constrains growth and may put businesses at risk)
Recession basics
Different countries have different definitions of recession, and those measures often lag. So it’s possible to be in a recession without knowing it until some time later
In the UK, a recession is when gross domestic product (GDP) falls for two consecutive (three month) quarters
Recessions are characterised as periods when economic activity declines, consumer spending falls, businesses cut costs, cancel investments and lay-off staff
Research shows that stock markets tend to sell off in anticipation of recessions and begin to recover before they end. This reflects the forward-looking nature of markets as they try to anticipate changing economic conditions.
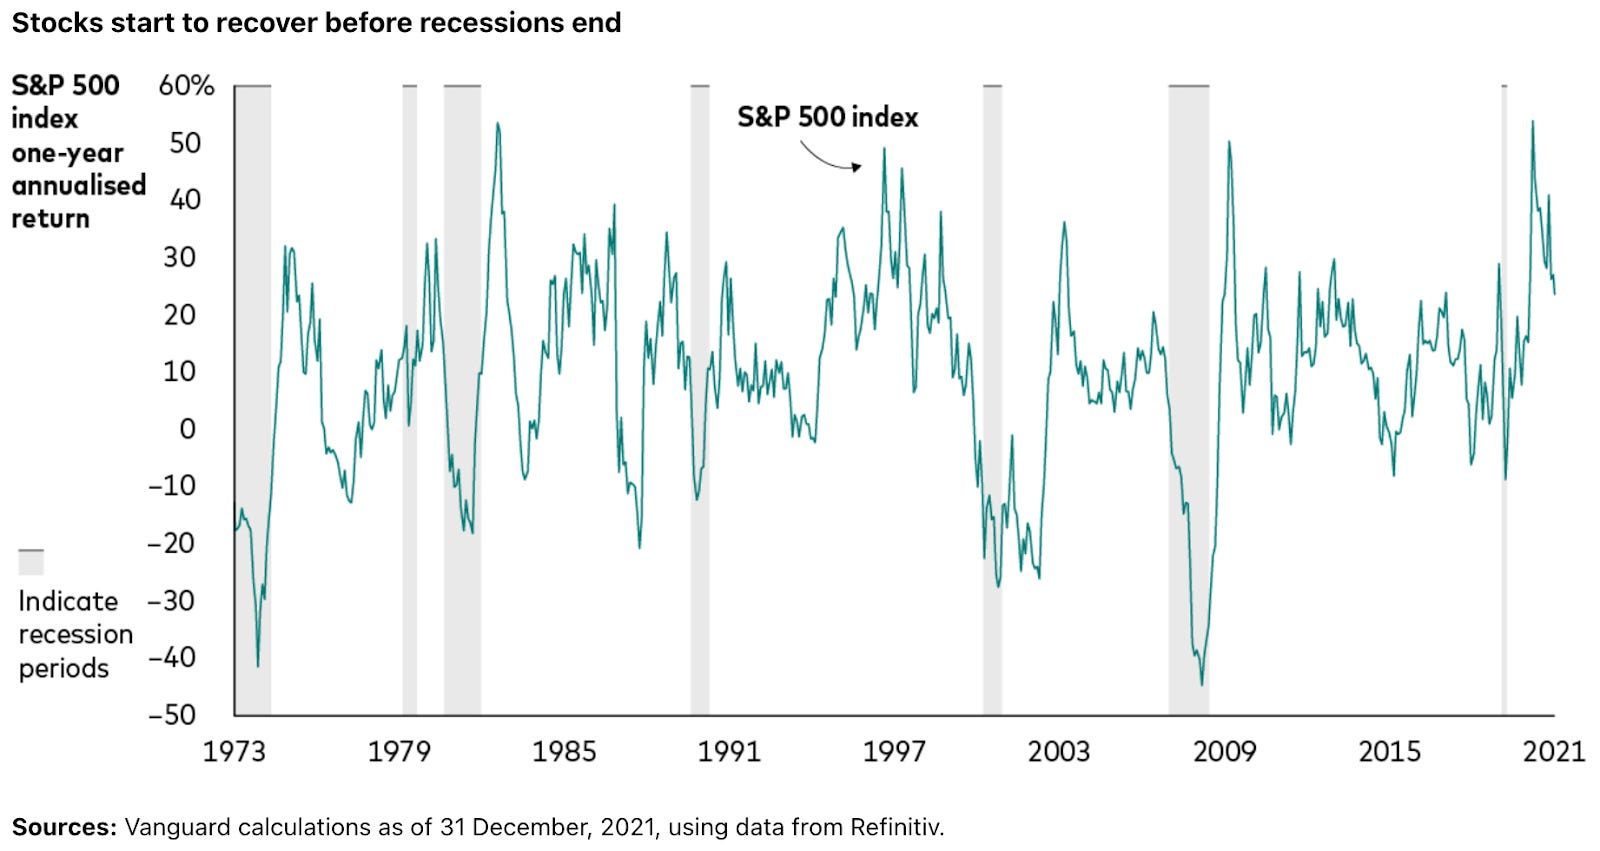
Among the most serious recent recessions were the 2008-09 financial crisis (five quarters) and the 2020 Covid pandemic (two quarters), both of which saw sharp sell-offs in the market.
Note that the dotcom crash in 2000, and the global sell-off and Brexit turbulence in 2016 didn’t coincide with recessions.

Note! Inflation and recession are usually separate economic phases, but they are linked. When they occur together it’s called ‘stagflation’, and it and it’s often associated with cost-push (bad) inflation, which happens when there are supply shocks in the economy.
When to use this strategy
This strategy aims to find shares that have the financial strength to defend themselves against economic pressure. It is designed for periods when the economy is facing a downturn and the market has become volatile in the face of economic uncertainty.
Research shows that economic downturns shift investors into more defensive areas of the market, such as high dividend yield, low volatility (relatively low price sensitivity to the market) and higher quality (profitability and financial health).
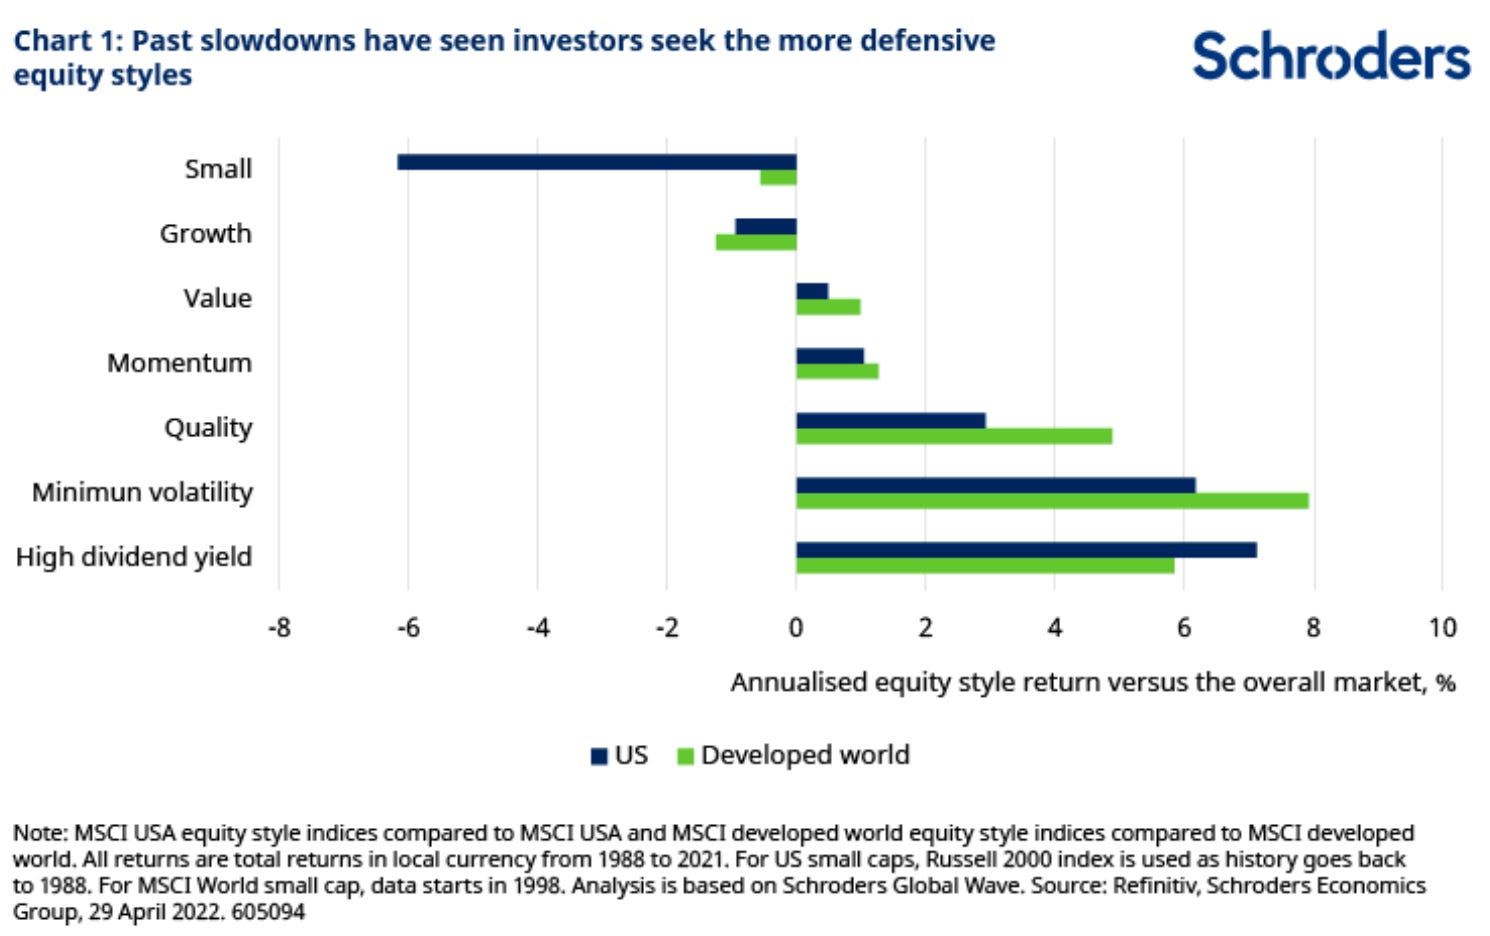
Note! Faced with inflationary or recessionary pressures, smaller companies and high growth companies often fall out of favour. That’s because they are often more sensitive to turbulence.
Smaller companies are more financially vulnerable to setbacks. They are less diversified in terms of product, market and geographical exposure and their finances tend to be weaker.
Growth companies (which can include firms that are pre-profit) can have strong upside in stable conditions but become far more risky in a downturn.
Growth stocks are often valued on the cash flows investors think they will achieve in the years ahead (known as discounted cash flow valuation). Inflation and recession can make these assumptions difficult because the future value of cash (and the strength of the economy) become uncertain.
Strategy checklist
1. Is the company in a defensive sector that could be more resilient to economic turmoil?
Research shows that the share prices of companies in defensive industry sectors are more resilient during heightened economic uncertainty than those in more cyclical sectors.
This is because companies in defensive industries have the benefit of producing goods and services that tend to be in demand in both good times and bad. It can also be because firms in the sector are not directly affected by economic conditions. Either way, it makes them a more attractive option for investors looking for safer havens.
This table shows how defensive industry sectors have tended to perform better than cyclical sectors during periods of stagflation.

Defensive sectors include healthcare and utilities, as well as consumer staples like food production, household goods, beverages and tobacco. Companies in industrial, technology, telecoms and energy sectors can also have defensive traits, but some are more sensitive to economic conditions than others.
What to look for:
Company shares in defensive sectors: healthcare, utilities and consumer staples (and industrial, technology, telecoms and energy sectors depending on the conditions)
2. Does the company have strong profitability that can protect it from rising costs and potentially lower demand?
In quality investing, an important indicator of company strength is pricing power. One way to think about this is the difference between companies that are price ‘takers’ and price ‘makers’.
Price takers have little control over the price they’re paid for goods and services. You often find them operating in competitive markets.
By contrast, price makers do have control over what they charge their customers, so they effectively make the price - and it can be a big competitive advantage. Pricing power is a major consideration for investors who look for companies with competitive ‘moats’.
Pricing power can show up in a company’s profit margins, which are the difference between a business’s revenues and its costs. Ideally you want them to be as high (and consistently high) as possible so they insulate the firm from rising input prices and lower demand. Firms with pricing power are often better at passing on higher costs to customers.
Look for double-digit margins that are stable over time and higher than other companies in the same sector. Here are some measures you could use:

What to look for:
Does the company have high margins compared to industry peers?
Are the company’s operating margins high and generally stable over the past five years?
3. Is the company a ‘profit machine’? Is it efficient at sweating its assets and its capital to deliver consistently strong profitability?
In buoyant economic conditions, many investors will forgo profits today in return for fast growth and bigger payoffs later on. In poor economic conditions, the opposite happens: profitability becomes a priority.
On a company income statement, there are several measures of profitability, including:
Gross profit
Operating profit (which is also called EBIT - earnings before interest and tax)
Pre-tax profit
Net profits (earnings, or earnings-per-share)
Here are two examples of how those profit measures are typically presented on an income statement:

When it comes to finding a profit machine, the key is to understand how efficient the company is at making those profits. That means looking at how good it is at generating a return from the assets (and debt) at its disposal.
Here are some ideas:
Return on Equity (ROE)
This compares a company’s profit (shown on the income statement) to all the funds attributable to shareholders (shown on the balance sheet as ‘shareholders’ equity’). This is the formula:
Net Profit / Shareholders’ Equity (Shareholders’ Equity = Total Assets - Total Liabilities)
It tells you what would be returned to shareholders if the company was liquidated. Just as importantly, it’s a measure of the efficiency of the company’s profitability.
You want to see a high percentage ROE that is stable or improving over time and compares favourably against other companies in the same sector.
Note that ROE does not take account of debt, which can have a big influence on profitability. To deal with that, you can look at:
Return on Assets (ROA)
This compares a company’s profit to all the assets that it has on its balance sheet. Those assets include items like cash, cash owed, equipment, plant and machinery, and debt. This is the formula:
Net Profit / Total Assets
The aim of this ratio is to show how efficient a company is at generating a return: the higher the ROA, the more efficient the company is likely to be. High stable returns over time are desirable - but comparisons should only be made against other companies in the same sector.
Return on Capital Employed (ROCE)
This compares a company’s operating profit to the capital it is employing to generate it. Capital employed in this equation is Total Assets minus Current Liabilities, so Total Assets includes long term debt. This is the formula:
Operating Profit [also called EBIT] / (Total Assets - Current Liabilities)
ROCE is a popular measure of a company’s ability to generate a return from the capital it puts to work. Like other profitability measures, high, stable and improving ROCE’s are desirable and it’s best to keep comparisons within similar industry sectors.
What to look for:
Minimum double-digit, stable and improving measures of profitability including Return on Equity, Return on Assets and Return on Capital Employed
4. Does the company have a strong track record of paying dividends?
Evidence shows that while company earnings can fall sharply during recessions, dividends are much more resilient. As you can see from this chart, payouts tend to hold up surprisingly well over time:

Faced with a deteriorating outlook, dividends are one of the easiest cost-cutting measures that management can take. But while some companies do reduce payouts in a crisis, many others will go far to avoid doing so.
Apart from annoying shareholders, a dividend cut can send a negative signal to the market that the company is in a weak position or has been overzealous with its payments in the past.
It’s also the case that good dividend payment records are eye-catching and point to good financial management, so companies are often loath to interrupt them.
For this strategy, there are appealing reasons to focus on companies with strong dividend records:
Payouts (either taken as cash or reinvested) are a valuable source of returns when share prices are coming under pressure
Dividend-paying shares have been found to be less volatile during bearish conditions
A strong dividend track record can be a pointer to well-managed, disciplined and financially robust businesses
Strong dividend records are common in defensive sectors (which this strategy also looks for) such as utilities, healthcare and consumer staples
If you can find a history of dividend growth, even better. Regular hikes in the payout can help absorb the impact of inflation and may point to firms that are successfully passing higher costs on to customers
Note! Beware of shares on exceptionally high yields. While high yields can be attractive, they can also be a warning that either the dividend (or the company itself) is at risk. You can read more about that in the Safe High Yields strategy.
What to look for:
Look for a track record of dividend payments (and preferably growth) over several years
Beware of excessive yields (anything more than 6% needs checking for credibility)
Look for companies with dividends that are well covered by earnings (a dividend cover of more than 1.5x)
Note! Don’t forget that vast numbers of companies suspended payouts during the Covid pandemic. This disrupted many dividend payout and growth records.
Screen rules
If you have access to a share screener, here are some rules you can use or adapt however you like:
Sector includes healthcare, utilities, consumer staples, industrials, technology, telecoms, energy
Operating margin last year >10
Operating margin 5 year average >10
Return on Equity last year >10
Return on Equity 5 year average >10
Return on Assets last year >10
Return on Assets 5 year average >10
Return on Capital Employed last year >15
Return on Capital Employed 5 year average >15
Dividend payment record >5 (years)
Forecast dividend cover >1.5
Strategy risks
While a strong history of profitability is encouraging, the backward-looking nature of these measures isn’t always an accurate guide to the future. Companies in all industry sectors can be susceptible to both inflation and recession, so care is needed in the search for firms that can remain unscathed through these phases.
Strategy summary
Weak economic conditions can hurt the fortunes of individual companies and damage investor confidence across the market. This can lead to indiscriminate selling, pushing prices down across the board.
Research shows that stock markets are quick to price in recessionary phases and recoveries. With that in mind, there is an opportunity to take a more defensive approach whilst still having exposure to higher quality shares that should benefit when conditions improve.
This strategy looks for companies with a track record of strong profitability in sectors that suffer less from economic turmoil. It also looks for a solid dividend track record as a proxy for good financial discipline as well as additional source of returns.
Take it further
To take the ideas in this strategy further, check out these other strategies…
How to find shares with high dividend yields (that won’t let you down)
These articles are for information purposes only. The content is not intended to be a personal recommendation to buy or sell any financial instrument or product, or to adopt any investment strategy as it is not provided based on an assessment of your investing knowledge and experience, your financial situation or your investment objectives. The value of your investments, and the income derived from them, may go down as well as up. If in doubt, seek advice from a qualified investment adviser.